INTRODUCTION
Jasper iReport is an open-source report designer for JasperReports & JasperReports Server. It helps you do these following things
- Create beautiful layouts containing charts, subreports, crosstabs, and images,
- Access your data through XML Hibernate, JavaBeans, JDBC, TableModels, CSV and custom sources, and
- Publish your reports as RTF, HTML, XHTML, CSV, XLS, XML, DOCX, OpenOffice and more.
Jasper Reports is in some way the core of Jasper iReport designer. Jasper iReport is extremely easy to integrate with a Java application. However, if you want to use the reports without having to write a custom application, you may consider using – Jasper Reports Server.
Summarizing it all, you can design reports using Jasper iReportDesigner, execute them and generate output in a Java application using Jasper Reports, and publish the reports securely using Jasper Reports. With the help of Jasper Server, you can also make reports interactive by adding drill up and drill down capabilities to your document.
However, the basic building block of a report is the element. Everything gets created through elements, which can create tables, contain text, display images, and so on.
JASPER iREPORT LIFECYCLE
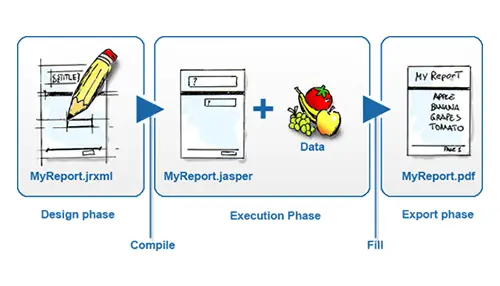
The different phases of the Jasper iReport Lifecycle are as follows:
1. Designing the Report: In this step, the JRXML file is created. This is an XML document that contains the definition of the report layout. You can create any text editor or Jasper iReport Designer to create it manually.
2. Compiling the Report: In this step, the compilation of JRXML is in a binary object called Jasper file. This is done by taking performance reasons. Jasper files are what required to ship the application to run the reports.
3. Executing the Report: Here, data from the application is filled in the compiled report. The class provides the necessary functions to fill the data in the report. A Jasper print file is also created to either print or export the report.
4. Exporting the Report: You can export the created Jasper print file to any format using JasperExportManager. Jasper Reports provides several forms of exports, so, you can create representations of the data in multiple ways.
JASPER iREPORT ELEMENTS
Jaspersoft Studio allows a combination of nine basic elements offered by the Jasper Reports Library to produce a report of every kind.
- Static Text
- Ellipse
- Frame
- Crosstab
- Subreport
- Break
- Chart
- Rectangle
- Line
Jasper iReports allows developers to integrate their own custom components and generic elements to create a proper plug-in by adding support in Jaspersoft Studio. You can integrate the library in your open or commercial application to generate the reports deigned with Jasper Reports Designer, display them on-screen or export them in a final format like DOCX, OpenOffice, PDF, and others.
1.BASIC ELEMENT ATTRIBUTES
All the elements have a set of common attributes or properties that are present in the element Properties view. The available attributes always depend on the element type.
- Set the text style, size, color, and location of the field with the Appearance tab.
- Set the padding and border style, color, and width of the field with the Borders tab.
- Define unchangeable text for a field, and control its appearance with the Static Text tab.
- Place text in an element with the Text Field tab.
- View any attributes inherited from another level with the Inheritance tab.
- Define a hyperlink in an element with the Hyperlink tab.
- Displayed detailed information about the element with the Advanced tab.
2. INSERTING, SELECTING, AND POSITIONING ELEMENTS
i. Inserting Elements: To do this, drag the element from the palette into a report band. The new element will appear in the report editing area.
ii. Selecting Elements: To select the element, click in the report editing area or the Outline view. Adjust the element by dragging it, to modify its size.
iii. Positioning Elements: Jaspersoft Studio offers several ways to place the elements with precision in your report.
-
a. Using the Grid: If you want to align and position the elements in the page, turn on the grid in the design pane.
b. Using Bands: The values that define the element’s position is usually a band but can be a frame element and are always relative to the parent container.
3. TEXT ELEMENTS
There are two specific elements to display the texts in a report – static text & text field.
i. Static Text: It displays non-dynamic text in reports. The Text property distinguishes this element from a generic text element, where the text to view is specified – it is normal text, not an expression, and hence is necessary to enclose it in double-quotes to respect the conventions of Java or JavaScript syntax.
ii. Text Fields: It allows you to print an arbitrary section of the text created using an expression. An expression can contain fields, variables, and parameters, so you can print the field’s value and set its format to present.
4. GRAPHIC ELEMENTS
Graphic elements are drawing objects like rectangles and lines; they do not show data, but they are used to make reports more readable and attractive. You can add graphic elements by dragging from the Designer Palette to the report editing area.
Summing Up
At OdiTek Solutions, we empower people to make better decisions faster by bringing them actionable insights inside their business processes through a cost-effective reporting and analytics platform.
Click to learn more about the best open-source reporting tool – Jasper Reports.
For any further information, write to us at info@oditeksolutions.com.


