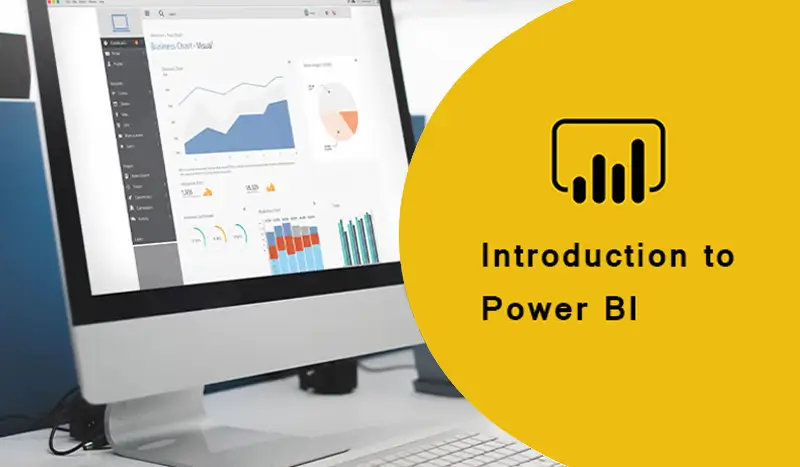
With the advancement of technology, the concept of Business Intelligence is now alien to very few people. You can notice more and more interactive BI tools emerge every single day, appealing to many organizations to assist them with their crisis. In such a scenario, experts who are certified in Microsoft’s Power BI tool end up being brilliant. The reason is Power BI is mainly designed in such a way that its only focus is to help everybody analyze and visualize their data. The best thing about Power BI is that even non-technical people can use this tool very easy to create interactive Power BI reports.
Power BI is a suite of Business Intelligence, reporting and data visualization products and it comes with so many advantages including streamlined publication and distribution capabilities but is it a potential fit for your organization?
Let’s find out!
What is Power BI?
Power BI is a business intelligence software that transforms totally irrelevant data sources into lucid, interactive reports, and dashboards, let that be an excel sheet or cloud-based service power BI can handle it all allowing raw data to become real insights!
A Power BI report is a multi-perspective view into a dataset and a report consists of single visualization report or multiple visualization reports which represents a dashboard but serves different purposes. It allows its users to add/remove data, apply filters in the visualization model to look for insights as well as appropriate answers. Power BI allows you to easily connect data sources, visualize the info, and share reports with anyone across your team or organization anytime!
Features of Power BI
Power BI holds certain incredibly powerful features that helps you carry out the following activities very easily. It lets you-
i. Create interactive reports in minutes
ii. Schedule and automate reports
iii. Visualize and analyze data quickly
iv. Explore data in a detailed manner
v. View live dashboards with real-time updates
vi. Maintain all of your data in one place
Power BI Usage
The basic architecture of Power BI is made such that each person in an organization can use it to execute their tasks or extract required information but how do you want to use Power BI within your organization that completely depends upon your role on a particular team or project.
A data analyst usually spends most of his timing on playing around with numbers. Power BI here allows the analyst to organize and analyze the data and then publish reports with complete accuracy to make them accessible for the right user inside the organization.
A CEO can receive an automated Power BI report to have a complete overview of key matrices and performance indicators where as a salesperson may need Power BI services to generate lead details and other related information.
How individuals in an organization can use Power BI Reports
Power BI being a next-generation intelligence software meets the rising demands of many.
i. Power BI has been proved beneficial when it is integrated as a solution within the organization. It can be customized and maintained by the tech managers so that it will work as per the requirement of the particular job and the people associated with that particular task.
ii. Power BI APIs can be used by developers to push data into data sets or to embed dashboards. This allows them to synthesize information from multiple systems and data sets into easily understandable visual models that can be displayed as per the requirements of the project.
iii. Admins play a crucial role and service the capacity of dealing with provisioning of licenses, usage monitoring, Power BI tenant, governance policies, and company resources.
The final outcome is that whoever has the access to the reports and dashboards can view or make changes to the reports. The members can be the stakeholders, management, employees, or customers.
Power BI Tools
These tools can be defined as the types of software that are used to collect, process, analyze, and visualize large volumes of data (past, current, and future) to create interactive reports, generate useful business insights, and streamline the decision-making processes.
The Power BI tools include certain important features that empower users with automated reporting and predictive analytics features such as visual analytics, data visualization, interactive dashboarding, and KPIs.
Conclusion
As you can see, Big data is all around us that is increasing every year at a rapid pace. Power BI helps your data management more agile, predictable, and cohesive with plenty of features it has to offer, making you stand to reap great rewards.
If you also want to create custom visualizations to view your data in a unique and tailored way like most businesses then Power BI is the right pick for you.
Reach out to us to explore the incredible business intelligence tools and start with a modern BI solution for your business!
To gather more insights, Visit our Skill page
