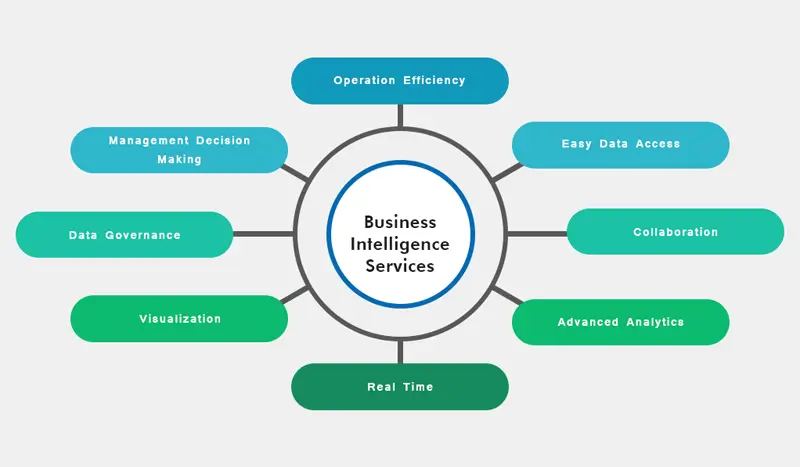
Reporting is one of the primary facets of business intelligence although business intelligence does not tell business users what will happen for a certain course, neither is BI solely about generating reports. However, the dashboard is one of the most archetypical business intelligence tools. These are hosted software applications that arrange accessible information into charts and diagrams that provide a brief idea about the current state of the organization.
Business intelligence allows people to analyze data to get drifts and derive insights by streamlining the effort required to look for, merge and query the data important to settle on strong business choices.
Let’s understand this in detail by a short example-
Xyz Company wants to revamp its supply chain to determine the gaps in their business such as delays and variabilities that is occurring in the shipping processes. They can utilize BI capabilities to discover the products that are mostly delayed or the modes of transportation that are most often caused by delays
How Business Intelligence Reporting Tools work
Before the introduction to BI, businesses had to carry out most of their analysis manually, but BI tools saved companies time and effort by automating many of the processes. Business Intelligence follows four key steps to convert raw data into simple and understandable insights for everybody in the organization to utilize. The four steps are such as data collection, analysis, data visualization, and decision making.
Step-1: Data Collection
Business intelligence tools use the ETL (extract, transform, and load) method to collect both structured and unstructured data from various sources. This information is then changed and redesigned prior to being stored in a primary location, so applications without much of a stretch can analyze and inquiry it as one comprehensive data set.
Step-2: Data Analysis
Automation comes into the picture here for quickly analyzing data to identify the patterns and outliners that will deliver insight into the current state of business. Various types of data models and analytics (such as exploratory, descriptive, statistical, and predictive) are often used by business intelligence tools to further explore the data and suggest necessary recommendations.
Step-3: Data Visualization
Data visualization makes data findings easier to gather and share. Business intelligence reporting services include various types of charts, graphs, maps, and dashboards to understand the detailed analytics of a business at that current state.
Step-4: Evaluation and Actions
Comparing the current data with the past data businesses can identify the gaps and the solutions to fill in those gaps. Business intelligence tools enable businesses with the ability to quickly move from insights to action. It also suggests long-term strategic changes along with real-time adjustments to rectify supply errors, eliminates inefficiencies, adapts to market shifts, and eradicate customer issues quickly.
Advantages of Business Intelligence Tools:
Business Intelligence tools have been proven as the most effective tools not only in eliminating inefficiencies, identifying potential problems and solutions, discovering new revenue streams but also in speeding up information analysis and finding new sources for future growth.
The following shows certain specific benefits that businesses experience by implementing BI tools-
i. Sets clear benchmarks comparing both historical and current data
ii. Analyses data and enables it to be shared across departments in real-time
iii. Shows precise tracking results for marketing, sales, and financial performance over time
iv. Delivers accurate insight into customer behavior and their shopping patterns
v. Improved operational process efficiencies and productivity
vi. Discover emerging business and market trends
vii. Helps in gaining a competitive edge over rival companies
viii. Provides immediate alerts about any kind of data anomalies and customer issues
Types of Business Intelligence tools and their Applications:
Business intelligence services cover a wide range of data analysis applications that are specially designed to meet various information needs. These applications are supported by both traditional BI platforms and self-service BI software.
Following are the list of Business intelligence technologies available to organizations-
1. Online Analytical Processing (OLAP)
OLAP is one of the traditional BI tools. It is designed particularly to work with complex queries and calculations. IT enables users to collect and analyze data across multiple dimensions providing them the authority to maintain a wide variety of data in a central location.
2. Mobile BI
With the advancement of technologies, BI applications are now available on smartphones and tablets and this is possible by the tool called Mobile BI. Since mobile phones are handy and are checked most often hence, Mobile BI tools are specially designed to simplify business intelligence needs and increase the usage rate.
3. Ad hoc analysis
This is considered the fundamental element of modern BI applications and an important key feature of self-service business intelligence tools. Ad hoc analysis or ad hoc querying is the process of writing and running various queries to analyze specific business complexities.
4. Software-as-a-service BI
These tools often use cloud computing frameworks that are facilitated by vendors to convey data analysis potentiality to clients as a form of subscription-based service. Saas BI which is also known as cloud BI offers a multi-cloud support feature that empowers organizations to install BI applications on various cloud stages to address client issues immediately.
5. Operational intelligence (OI)
This is a real-time analytical business intelligence tool that works as a middleman to deliver information to both managers and frontline workers. Operational intelligence tools are specially designed to aid in operational decision-making and enable immediate actions on the problems arising in the organization.
6. Real-time BI
Here the data is created, collected, processed, and analyzed to provide an up-to-date view of business operations, financial markets, customer behaviors, etc. to users. It also involves streaming data and supports decision-making in the area of stock trading, credit scoring as well as in promotional offers.
7. Open-source BI (OSBI)
This software primarily has two versions, one is free of charge and another is subscription-based. The free version is mainly community-based whereas the subscription-based version is used by vendors. For development uses BI teams can access the source code also some free editions of BI tools are primarily made available for individual users.
8. Location intelligence (LI)
This tool enables users to analyze geospatial and location-related data with map-based data visualization capabilities. It offers important insights on geographic elements in business operations. This helps in location-based logistic management and site selection for retail stores.
9. Embedded BI
Embedded business intelligence tools put BI and data visualization capabilities straightforwardly into business applications. This empowers business clients to break down information inside the applications they use to carry out their business. Although this embedded BI features are mostly deployed by application software vendors, it can also be used by corporate software developers in their local applications.
10. Collaborative BI
It is like a process and involves a combination of various BI applications and types of collaboration tools to enable multiple users to work together on data analysis in a single platform and share information with each other. Users can discuss BI information and analytics with remarks, questions, etc. through online chat.
Conclusion
Modern business intelligence tools typically offer adaptive connectivity choices, empowering it to connect to a wide range of data sources. Apart from this BI platforms are now rapidly used as front-end interfaces for big data information systems that holds a mixture of structured, unstructured, and semi-structured data. These features along with the relatively simple user interface (UI) in most BI tools, make it a perfect pick for big organizations.
The value that OdiTek provides in its BI reporting tools for business analysts and business users is reinforced by conveying considerably more control and accelerated workflows. Reach out to us today to know more about our business intelligence offerings.
