We are living in an exciting world. Anyone with a project idea and credit card can build a datacenter in minutes. Today’s world is just about efficiency and TIBCO Jasper Reports Studio brings you just that.
INTRODUCTION
TIBCO Jaspersoft Studio is a visualization report designer and an Eclipse-based report for TIBCO JasperReports and TIBCO JasperReports Server. Available as an Eclipse plug-in, the Jasper Studio Eclipse helps to create sophisticated layouts containing more than 50 types of crosstabs, charts, maps, images, subreports, custom visualizations, and much more.
Using Jasper Reports Studio, you can access your data through CSV, big data, JavaBeans, XML, JSON, NoSQL, JDBC, Jaspersoft Domain, TIBCO Spotfire Information Links, and custom sources. You can then publish the reports to Jasper Reports Server or use them in your own Java applications and export them as XML, XLS, RTF, PowerPoint, HTML, CSV, OpenOffice, text, or word.
Jaspersoft Studio comes in two editions – Professional and Community. The Professional edition allows additional functionality like access to HTML5 charts and Spotfire, as well as professional support.
JASPER REPORTS STUDIO REPORT DESIGNER
Jaspersoft Studio is a powerful, programmatic report designer for developers to develop data visualizations and full-fledged reports. It features the industry’s most advanced design environment and enables developers to create highly formatted, pixel-perfect reports, and data visualizations.
Following are the added features of Jaspersoft Report Designer –
- Stable and user-friendly SQL designer
- Full support for HTML Text component
- Full support for Google Maps as report elements
- Improved properties editor with a search feature
- Plugins for version control including GIT, SVN, and CVS
- Improved component layout options
- Improved Java Report Server integration
- New Jasper Reports Book Editor for reports linking and table creation
- New custom visualization component
- Improved out of box support for Hive, HBase, MongoDB data sources, and Cassandra
How Jaspersoft Studio Is Different From Other Report Designers?
More importantly, JSS has integrated several well-designed dialogs that allow a report developer to fine-tune the properties of the controls within a report. Like BIRT, JSS’s dialogs help guide report developers to the properties that they want to control. This is a significant Pentaho improvement which sums all of the control properties into a single grid structure.
As Jasper Reports Studio has much of the same functionality as the other report designers, it is also different from the other report designers in a few major ways:
1. Jasper Reports are different than BIRT, but same as Pentaho in a way that they rely on sub-reports to support reports with multiple queries and data sources.
2. Jasper Reports uses pixel positioning as its central approach and emphasizes on paginated reports at its core. This is similar to Pentaho, but different to BIRT which uses a table-based approach.
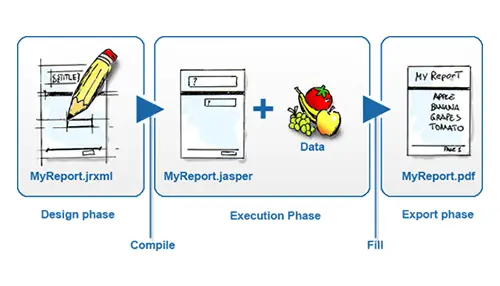
3. Jasper Reports must be compiled, and this is different from both Pentaho and BIRT.
4. Charting in JSS – easier and full-featured to use than Pentaho, and less full-featured and more difficult than BIRT.
Design & Layout
Jaspersoft Studio has a powerful layout engine that supports the same layout XML tags as Jasper Reports. Report developers can now put items on the screen just the way they want them to look like in the final pixel-perfect report. You can also place on-screen items using a snap-to or an automated grid layout.
Formulas like, conditions to hide an element, special calculations, or text processing define many settings in a report. You can write formulas in Java, JavaScript, or Groovy that provides a powerful way to gain control over report functionality.
Charts, Maps, and Graphics to Make Reports Come Alive
Jasper Reports Studio supports over 50 graphics types including –
Maps: Use TIBCO maps or Google maps to create interactive map visualizations. Use custom layers, markers, and shapes to display.
Widgets: This includes gauges, thermometers, sparklines, funnels, columns, cylinders, bulbs, and Gantt Charts.
HTML5 Charts: Interactive and customizable charts to visualize, including line, dual-level pie, column, bubble, bar, area, stacked area, time series, spider, and scatter. You can customize using properties that control every aspect.
Custom Visualization: Support visualization using third-party Javascript libraries like D3.js via the Custom Visualization component, any dynamically generated SVG.
Interactive Tables, Crosstabs, and Elements
Jasper Reports Studio comes with several elements that serve a variety of design goals, in case, you want to build useful and complete reports. There are various formats to support images, including SVG, loaded via URL, or even stored in the database as a BLOB. You can easily add lines, ellipses, and decorative frames to add style and structure to reports.
You can add tables with their datasets, have crosstabs with numeric calculations for a large amount of data, and an entire palette of components that let users visually design any report with intricate designs.
Widest Selection of Data Sources
Jaspersoft Studio supports the widest selection of data sources of any Jaspersoft Studio Report Designer to truly create visual representations of any kind of data. Each report contains the main dataset and supports any number of sub-datasets for the report to loop. Each data source has its type of query language, so several query editors are available including –
- NoSQL
- Domain
- OLAP
- Web Services
- Custom/Java
- Spotfire Information Links
- Files
- SQL (JDBC/JNDI)
Export to Any Format for Maximum Reusability
Jaspersoft Studio has powerful export capabilities. You can design reports and deploy them to several formats without any redevelopment needed. This provides design-time hints that help to produce friendly outputs for each format.
For example, you can view the same design on a web portal, export it to Excel for another group, email the JasperReports Server to yet another team, and consume through an API by a third-party tool.
Publishing Reports
You can use Jaspersoft Studio to design reports, but it’s not an ideal tool to publish them for end-user consumption. You can create standalone reports that you can view in Java applications that embed the JasperReports Library. Or, you can easily publish them with one-click to the Jasper Reports Server web application where users can interact with them directly.
An easy-to-use publishing workflow is present in the tool to facilitate publishing to JasperReports Server. All you need to do is authenticate to JasperReports Server and publish input controls, data sources, report definitions, images, fonts, etc. that you require for your reports and visualizations.
Install Jaspersoft studio into Eclipse – REQUIREMENTS
Jaspersoft re-built its report design tool for the Eclipse environment, called iReport on Netbeans. Jaspersoft Studio Netbeans is a Java-based tool that allows application and professional report developers to design highly formatted reports that you can view online or take a print out. The environment can connect to a variety of data sources via JDBC and format the data so that one can read it easily.
Software Requirements:
Jasper Reports Studio requires the Java Runtime Environment. To compile the report scriptlets, one will require full distribution of Java. The JSS installer includes the appropriate version of Java.
Jaspersoft Reports Studio supports the following operating systems:
- Linux, 32 or 64-bit
- MacOS X, 64-bit
- Windows 7/8, 32 or 64-bit
Hardware Requirements:
Jasper Reports Studio needs a 32-bit or 64-bit processor and 500 MB of hard disk space. The amount of RAM requirement depends upon report complexity. We recommend a value of 1 GB to dedicate to Jaspersoft Studio and suggest a value of 2 GB.
JASPER STUDIO ECLIPSE USER INTERFACE
Eclipse Interface –
The initial layout of the Jaspersoft Studio interface is called a perspective in Eclipse terminology. The default Jaspersoft Studio perspective contains views and an editor area.
- To open a closed window, select Window > Open View from the menu. Then select the window you want to open from the drop-down list.
- Reset the interface to the default perspective by selecting, Window > Reset Perspective.
- Save a perspective by selecting Window > Save Perspective As and enter a name for your perspective.
Learning More About Eclipse –
- You can start with the Eclipse help. Select Help > Subclipse – Subversion Studio Eclipse Plugin.
- If you’re setting up Eclipse for a team, search for the phrase “configuration management for Eclipse” on the internet.
- If you are working with version control such as SVN, Git, or CSV, use the corresponding Jaspersoft Studio’s Eclipse perspective. To add a different perspective, you can select the perspective you want from the Open Perspective dialog. Then, use that perspective for every interaction with your version control repository, like resolving conflicts, synchronizing files, and checking out projects.
User Interface Components –
Jasper Reports Studio has a multi-tab editor. It has three tabs – Design, Source, and Preview, which allows you to interact with your reports in various ways.
- The Design tab is the primary one that you can select to open a report file and it allows you to graphically create your report.
- The Source tab holds the jrxml source code for your report.
- The Preview tab lets you run the report preview after having selected a data source and output format.
Why Oditek Solutions?
We have some of the best Jasper Reports Studio developers in India, so, if you need more information on Jasper Studio Eclipse or Jasper Studio Report Designer, do reach out to us on – info@oditeksolutions.com
