Now a day’s businesses are searching for management solutions which are more effective and less hectic. And why not, who wants to spend more time in this mind jumbled thing for hours and hours rather utilizing that time to make some productivity out of the business. DevExpress technology gives you the Enterprise-ready DevExpress Reporting and DevExpress Dashboard which provides straightforward setup, intuitive administration and comprehensive report distribution options for individuals within and outside your enterprise.
Further proceeding on more, let us have some idea about DevExpress and it’s Reporting and Dashboard.
Introduction to DevExpress
DevExpress is a custom third-party provider of .NET controls. They customize the .NET controls by making it more attractive and more flexible than inbuilt .NET controls.
Once you get the license, then you would use their assemblies in your application to create a new UI experience which is completely different from inbuilt UI controls.
Devexpress provide us with customized controls having better look and enhanced functionality. DevExpress is a company that builds software development tools based on Visual Studio, they have created extensions (plugins) that are used inside Visual Studio to create your applications faster. They have created a number of different tools.
DevExpress Reporting
DevExpress Reporting is a feature-complete reporting platform for WinForms, WPF, ASP.NET WebForms, ASP.NET MVC and ASP.NET Core that enables you to create reporting applications.
Report Components –
Visual Studio Report Designer and Preview
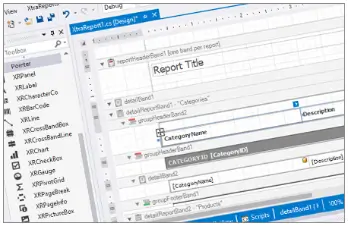
A feature-rich Report Designer for creating platform-agnostic reports in Visual Studio at design time.
You can publish the reports on any supported platform: Win Forms, WPF, ASP.NET WebForms, ASP.NET MVC and ASP.NET Core.
End-User Report Designer and Document Viewer
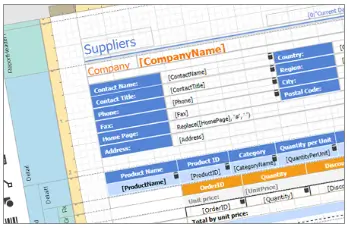
A fully customizable End-User Report Designer for WinForms, WPF, ASP.NET WebForms, ASP.NET MVC and ASP.NET Core platforms. You can integrate it into an existing application or create a new reporting application. You can localize your reporting application and specify its appearance.
Report Features –
Provide Data
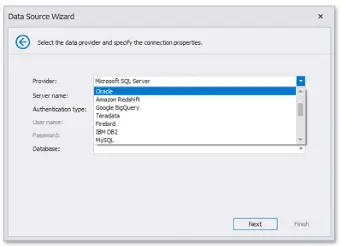
DevExpress Reporting allows you to use various data source types (SQL databases, Entity Framework data sources, custom objects or Excel files) to supply reports with data.
You can bind report elements to individual data source fields or create binding expressions of any complexity. These expressions can include multiple data source fields and functions.
Report Controls
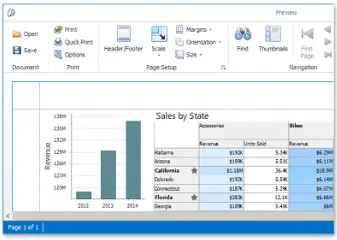
DevExpress Reporting includes controls like charts, cross tabs, gauges, bar codes, etc., for visualizing data.
Data Shaping
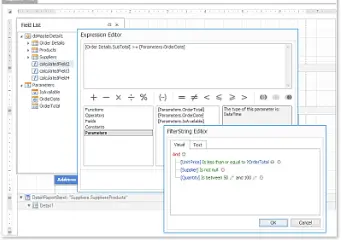
DevExpress Reporting supports the following data shaping features:
- Summarization: Allows you to compute summaries across report data fields.
- Grouping: Enables you to group data records and calculate summaries across groups.
- Filtering: Allows you to display only a data subset in your report.
- Sorting: You can arrange data records based on multiple criteria.
- Data Formatting: Allows you to apply standard .NET formats to report controls’ data values.
Parameters Support
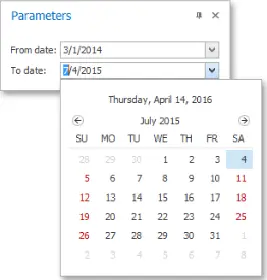
You can embed query parameters directly into a SQL string to filter data at the data source level.
Use report parameters to filter data in a previewed document. Multi-value and cascading parameters are supported.
Interactive Print Preview
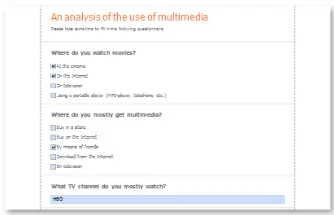
DevExpress Reporting supports interactive features for customizing reports in Print Preview.
Customize field values directly in a previewed document before printing or exporting it. You can use the standard editors or implement custom editors, validate the user input, and format edited values.
Add interactive sorting to enable end-users to toggle between ascending and descending order for report groups or for rows in a detailed table.
Create drill-down reports that allow end-users to control which report sections are displayed.
Report Navigation
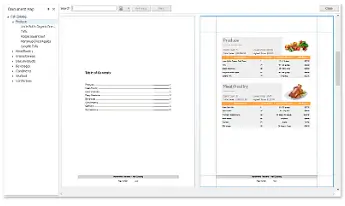
DevExpress Reporting allows you to create bookmarks and use cross-references to display the document structure in a document map and table of contents and switch between different document sections.
Styles and Appearance Settings
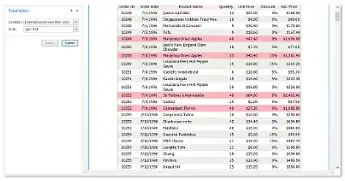
You can use style sheets to specify report elements’ appearance settings or conditionally change these settings.
Dev Express Dashboard
Documentation for the DevExpress Dashboard that allows users to create interactive data visualization for Desktop and Web platforms, and Mobile devices.
Get Started
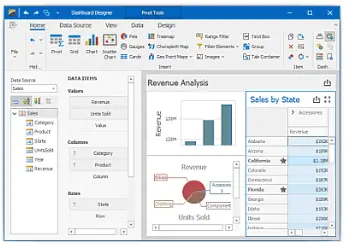
Build your Dashboard application for the selected platform and use this application to create or display a dashboard.
Basic Concepts and Terminology
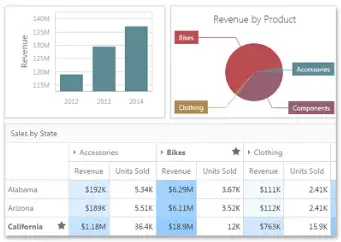
Learn about the main concepts and terminology related to the DevExpress Dashboard.
- DevExpress Dashboard Architecture – Contains a detailed description of the main dashboard terms.
- Dashboard – Introduces the concept of a dashboard that is the main component that visualizes data using different types of elements (dashboard items) – charts, grids and pivot tables, maps, etc.
- Dashboard Designer – Describes WinForms and Web controls that are the basis of Dashboard Designer applications.
- Dashboard Viewer – Describes the Dashboard Viewers that can be used to embed dashboards created in the Dashboard Designer into a Desktop (WinForms and WPF) or Web application.
- Dashboard Items – Lists the available dashboard items that are visualization elements designed to present visual or textual information in a dashboard.
- Data Sources – Provides the overview of available data source types such as SQL databases, OLAP cubes, Excel workbooks, etc.
- Measures and Dimensions – Introduces the concept of measures and dimensions that are used to manage data aggregation/summarization.
Common Features
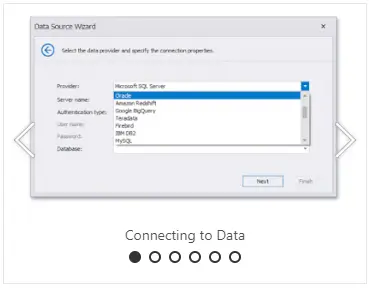
Explore the common DevExpress Dashboard features that allow you to transform underlying data to a dashboard.
Designer and Viewer Applications
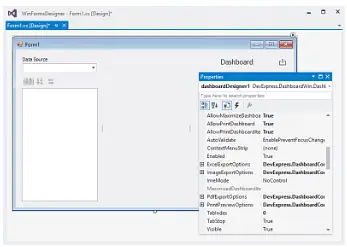
Prepare and integrate the Dashboard Control into a Desktop (WinForms and WPF) or Web application.
- WinForms Designer
- WinForms Viewer
- Web Dashboard
- WPF Viewer
Create Dashboards
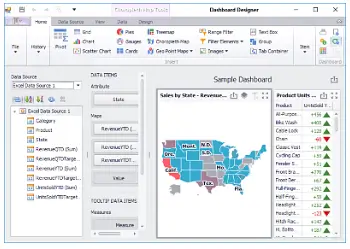
Create a dashboard in the Dashboard Designers available on different platforms.
- Create Dashboards in the WinForms Designer
- Create Dashboards on the Web
- Create Dashboards in the Visual Studio Designer
Conclusion
DevExpress Reports is a feature-complete reporting platform for the .NET Framework. Its ships with an easy-to-use Visual Studio report designer and a rich set of report controls, including pivot tables and charts so you can construct reports of unmatched elegance and informational clarity.
Based on the recently-redesigned DevExpress Web Dashboard core, our ASP.NET Web Forms, MVC, ASP.NET Core and client-side HTML5 controls offer you an all-in-one solution that lets you switch between Viewer and Designer modes right on the client, and an optional adaptive layout for tablet and mobile users.
OdiTek Solutions has some of the best .NET developers in India, if you need more information on DOT NET Development or performance improvement initiatives on existing .NET portals, do reach out to us on – info@oditeksolutions.com
